


We all know it is important to measure for results, but often we don’t know what to measure or how to interpret the metrics. Another issue is knowing what to do – how to change our behaviour – based on the metrics.
QUESTION 1: HOW CAN I UNDERSTAND METRICS SIMPLY?
Basically a good metric is:
- Understandable – one metric, not several
- Comparative– compare one state of affairs with another
- Shows movement – going up or down? Comparing A to B?
- Behaviour changing – wow look at this metric! We need to change that! OR wow look at this metric! How can we make sure this continues?
To measure for results there are three key principles:
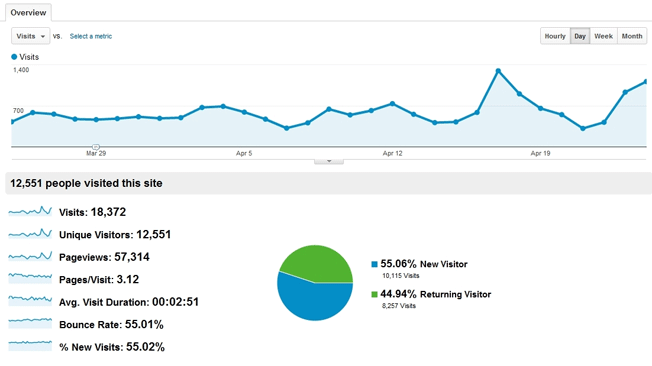
Principle #1: A metric should show movement up or down. If the metric stays the same it isn’t telling us anything new. The webpage metric below is not particularly helpful because it doesn’t show much movement.
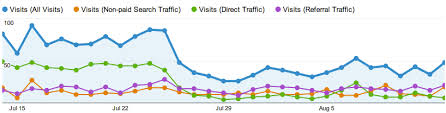
This metric is more useful. You can see that things have gone down and stayed that way for a while. The movement is telling you something you need to know:
Principle #2: A metric needs to be linked to business goals. If you learn something from a metric, it has to lead to action. We are usually measuring towards a goal and trying to achieve it by looking for indicators that show movement towards or away from the goal.
Here is an example of an indication in a metric visual. This visual shows a spike in activity on October 18th.
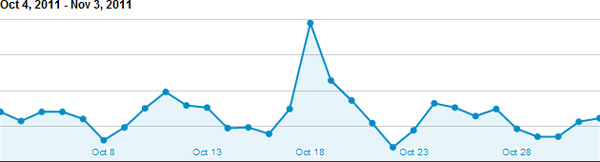
If you start looking for activity spikes like this, you can use them to predict your future actions towards your goal. For example we noticed that our best days for Twitter posts were coming on Wednesdays at three times during the day. So we used that to schedule our twitter posts so they hit the highest likely number of users. We changed our scheduling behaviour based on the indications we saw in our metrics. That resulted in people re-tweeting so we looked at the people who were re-tweeting and contacted them etc. Every time you see a new metric, you need to use it for the next behaviour change. Otherwise it is useless to measure.
QUESTION #2: HOW WILL WE KNOW IF THE BUSINESS GOAL IS ADVANCING? HOW DO WE APPLY PRINCIPLE #1 (MOVEMENT) TO PRINCIPLE #2 (BUSINESS GOALS)?
The answer to this question lies in leading and lagging metrics. If something has already happened, then it is a lagging metric. If something is leading towards a future result it is a leading metric.
For example if you lost all your customers last year you had a strong lagging metric. It has already happened. Lagging metrics are history. The good news is that you can use history to plan and correct. In the next visual the arrows show exactly where things went down and where they started to go up.

If you collect these metrics and compare them you will be able to ask your self a key question: What needs to change to reach the business goal? Then you watch the metrics again.
Maybe you need to cut costs during that low period. Maybe you need to advertise more just prior to that period. Maybe you need to focus on different products or services during that period. Metrics need to be used to change behaviour so you can reach the desired goal.
So if your customer complaints have risen sharply in the past month and you are paying attention to that metric, you can use them to predict loss of revenue and take action to change it. How? By diving into the complaints to find out what needs to be fixed and fixing it before revenue suffers. That is using customer complaints as a leading metric. Remember leading metrics predict the future.
You can use the same metrics to look at the past and to predict the future if you have a few to compare.
Like this image where the red and the blue are used to compare planned behaviour versus actual behaviour:
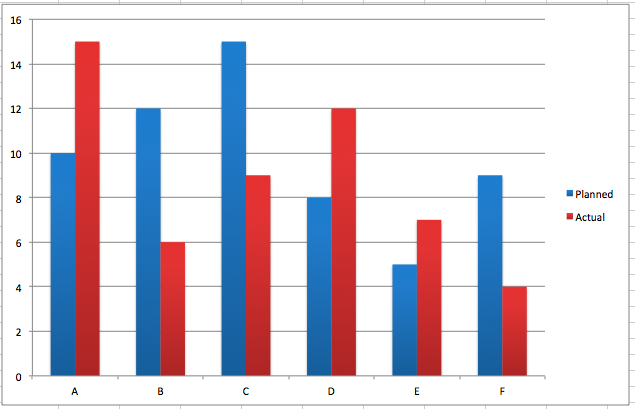
At first people were over-achieving their plans, then overshooting their capacity and dropping in their actual behaviour. Realizing this issue on day four, they pump up the behaviour for a couple of days and then get tired. Over all they are planning less and achieving less over a one week period. Perhaps this is not enough comparison. It might take three weeks to find the right balance. But having the ‘planned’ versus ‘actual’ behaviour compared is a useful metric.
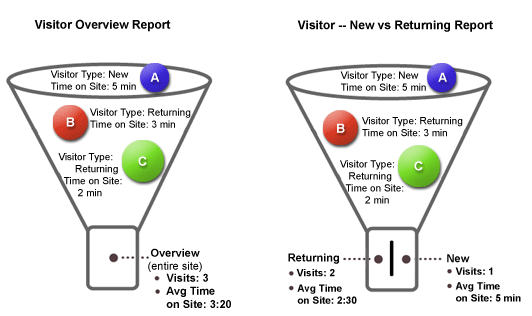
Consider this image that shows new versus returning visitors. Because you want visitors to return and to spend more time with you, this metric can be used predictively:
Or this comparison of pins versus pinners to decide which day of the week is your best visibility:
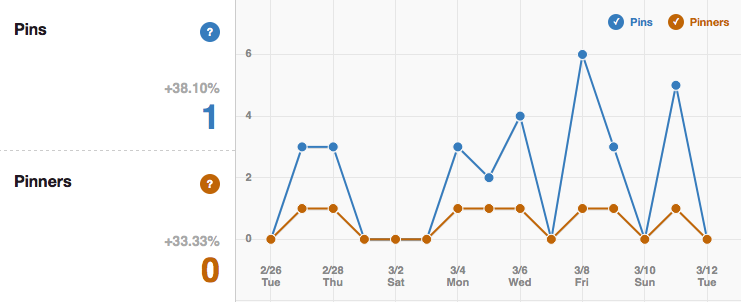
Based on this metric, some pinners don’t pin at all, some pin a lot. Of the people who pin, nobody pinned on Saturday but there were lots of pins on Friday. There was some good pinning activity on Wednesday and Sunday too. So what does that tell you? Looks like on Friday people are most likely to see your pins (maybe to avoid doing work or maybe because they are looking forward to the weekend) then they are too busy on Saturday – but Sunday while they relax they are looking at pins. Not sure about Monday and Wednesday yet. But Tuesday is looking good.
If you are a restaurant, what kind of business action would be smart based on what this metric is telling you? Pin lots of pictures of your awesome restaurant food items on Friday and Sunday and you will be attracting the pin crowd more effectively to buy your food. And start thinking about Tuesday pinning too.
Principle #3: Metrics only become motivators for change when they are visual. As you can see, the examples above were all images – not a series of numbers. You may have a series of numbers but until they become visual, there isn’t much urgency attached to them. So put your metrics into visuals and things will become clear more quickly.
| In summary a good metric is:
Understandable – one metric, not several Comparative– compare one state of affairs with another Shows movement – going up or down? Comparing A to B? Behaviour changing – wow look at this metric! We need to change that! OR wow look at this metric! How can we make sure this continues? |
The three key principles to remember when watching metrics to measure for results are:
Principle #1: A metric should show movement up or down Principle #2: A metric needs to be linked to business goals. (use leading and lagging indicators to help you with this) Principle #3: Metrics only become motivators for change when they are visual. |
A reflection question to the reader:
QUESTION 3#: HOW CAN YOU USE METRICS TO MEASURE AND CHANGE BEHAVIOUR TOWARDS A BUSINESS GOAL?
References:
Shah, Dahrmesh. (2013, March 29). Measuring What Matters: How To Pick A Good Metric
http://onstartups.com/tabid/3339/bid/96738/Measuring-What-Matters-How-To-Pick-A-Good-Metric.aspx. Correct on October 5, 2015.
Friedman, Brian. (2012). Metrics, Metrics On The Wall, Who’s The Vainest Of Them All?
Correct on October 5, 2015.